Devlog: Wave Function Collapse #2: Optimizing This Mess with Perf
2023-06-25
| Prev | GitHub | Next |
In the previous post, I described how I’ve implemented the WFC algorithm. I haven’t put much effort into optimizing it, so it was rather slow. Since then, I’ve made it quite a bit faster. But before I get into that, a few words on other things I’ve done.
I first wrote some tests. WFC is tricky to write tests for because it’s non-deterministic and it is expected that it may fail to generate an image. So, I kept the test cases simple but made them more useful by running them with ASan, UBSan, MSan, and Valgrind. Those tools helped tremendously by detecting a bunch of errors throughout revisions. The tests are compiled with -Wall -Wextra -Wconversion -pedantic -Werror. I would also just run the algorithm and visually inspect generated images for extra confidence.
To be able to objectively tell if I’m making my code faster, I created a benchmark program. The aim was to give it input and output of decent sizes, but have the input be such that it is unlikely for WFC to fail. There are two test cases that are run 5 times each: one uses a simple image from the original WFC repo, and the other uses a series of 0s and 1s I generated randomly. It’s simple, but it served its purpose. The code’s compiled with -O3 -mavx2.
For profiling, I used Linux’s perf (aka. perf_events). I recommend https://www.brendangregg.com/perf.html on how to use it. I used Mozilla’s online profiler to view the flame graph because it’s free and doesn’t require me to install anything.
Optimizations
Disclaimer: I am not a performance expert, merely an enthusiast. One reason I decided to implement WFC is to learn how to better profile and optimize code.
This benchmark result is my starting point:
image=external/samples/Angular.png repeats=5 args={n=3 dstW=64 dstH=64}
        avg=9.7969 min=8.4966 max=10.2870
image=benchmark/test.txt repeats=5 args={n=5 dstW=120 dstH=120}
        avg=16.3255 min=16.0138 max=16.5205
Let’s run perf.
perf record -g -F 99 -- bin/cli "external/samples/Angular.png" 3 64 64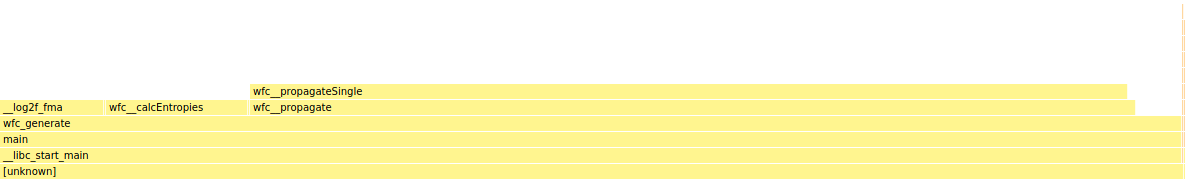
No surprises here, constraint propagation is the slowest part of the algorithm. Before I get into micro-optimizations, I’d first try to make larger algorithmic improvements. I described how propagation works in the previous post. Some reminders:
- a wave in WFC tells us, for each point in the output image, which NxN pixel patterns may be placed with that point as the top-left corner;
- WFC is a constraint-solving algorithm whose goal is to collapse each wave point to a single pattern, without any pixel contradictions in their intersections;
- on each iteration, a single wave point is picked and observed (ie. collapsed to a single pattern), after which constraints are propagated;
- when a wave point loses some of its allowed patterns, that may cause nearby points to get further constrained (you can’t place a blue pixel there because I no longer have any patterns that place blue pixels at that spot).
One function that gets called many times during the propagation step calculates whether two patterns, at a specific 2D offset from each other, are allowed to overlap (ie. whether any pairs of pixels in their intersection would contradict). This can be pre-calculated at the start and then used in each propagation step, which would reduce the time complexity of the algorithm.
So that’s what I did. Result:
image=external/samples/Angular.png repeats=5 args={n=3 dstW=64 dstH=64}
        avg=3.7828 min=3.3855 max=4.0377
image=benchmark/test.txt repeats=5 args={n=5 dstW=120 dstH=120}
        avg=15.4631 min=15.3088 max=15.8109
Constraint propagation means going through recently constrained wave points and checking if their neighbours need to be further constrained. If yes, the same process is applied to those points. And on, and on… This all starts from the point that was previously observed (ie. randomly chosen and collapsed to a single pattern). A single point may get constrained several different times during the same propagation step. Here’s a textual visualization of how this process moves among wave points: propagation.txt (1.4 MiB).
Previously, I would naively iterate through all output points, check if they have been further constrained, and apply the above process on them. I decided to change this to aggressively prefer checking the neighbours of the modified wave point that’s closest to the originally observed point. The reasoning was that if the same point gets modified on two separate occasions, it could send out two separate (and computationally expensive) series of updates. I wanted to have the second set of updates happen sooner so that for outer points they both get done at the same time.
Did any of that make sense? No? Well, it doesn’t matter because the idea did not make the code faster. And no matter how clever an idea might seem, if it disagrees with the benchmark - it is wrong! (I’m totally gonna disregard this advice further down.)
All was not in vain, though. In the previous post, I went on about how I propagated in a double-buffering fashion. While this allowed me to make the textual visualization linked above, I realized it was completely unnecessary. So I did away with it, making my code simpler and a bit faster.
Result:
image=external/samples/Angular.png repeats=5 args={n=3 dstW=64 dstH=64}
        avg=3.2211 min=3.1070 max=3.3096
image=benchmark/test.txt repeats=5 args={n=5 dstW=120 dstH=120}
        avg=13.6449 min=13.5581 max=13.7805
At this point, I couldn’t think of anything clever to improve the algorithm. Time to use a profiler. It’s clear that propagation is the bottleneck, so let’s see what’s happening inside it. perf report helpfully tells us that this is the hottest instruction:
21.53 │ cmpb $0x0,(%r14,%rax,1)Some innocent-looking zero-comparison is wasting a lot of time. To tell what part of the source code it corresponds to, I used Clang’s -S option to compile into assembly language:
clang ... -g -fno-omit-frame-pointer -O3 -mavx2 main.c -SI inspected the code around the cmpb instruction. It turns out that comparisons correspond to two ifs in very nested code that index into the wave (a 3-dimensional array). Why is that slow? The other functionality of perf tells us:
$ perf stat -d -- bin/cli "external/samples/Angular.png" 3 96 96

 Performance counter stats for 'bin/cli external/samples/Angular.png 3 96 96':

         10,862.28 msec task-clock                #    1.000 CPUs utilized
                 4      context-switches          #    0.000 K/sec
                 0      cpu-migrations            #    0.000 K/sec
               223      page-faults               #    0.021 K/sec
    42,749,721,058      cycles                    #    3.936 GHz                      (49.94%)
    62,608,412,101      instructions              #    1.46  insn per cycle           (62.46%)
    10,156,336,241      branches                  #  935.010 M/sec                    (62.51%)
       187,108,631      branch-misses             #    1.84% of all branches          (62.51%)
    14,869,486,753      L1-dcache-loads           # 1368.910 M/sec                    (62.56%)
     3,407,349,755      L1-dcache-load-misses     #   22.92% of all L1-dcache accesses  (62.53%)
       301,880,820      LLC-loads                 #   27.792 M/sec                    (49.98%)
            31,494      LLC-load-misses           #    0.01% of all LL-cache accesses  (49.97%)

      10.862962266 seconds time elapsed

      10.862956000 seconds user
       0.000000000 seconds sys
22.92% of L1 lookups are misses. perf even marked this number in red. The problem is that, in my multi-dimensional array implementation, the first coordinate is the fastest-growing one and the last coordinate is the slowest. This is the opposite of how I iterate over those arrays.
A WFC wave contains output width * output height * pattern count bytes (bools). I usually iterate through each bool for a single point. In the input run above, bools for two consecutive patterns for the same point are 96*96=9kiB apart and the entire wave weighs 96*96*49=441kiB. Other input images can yield hundreds of patterns, making that distance 10+ times bigger. Most (all?) L1 caches are not big enough to fit more than a few consecutive bools when they are so spread out in memory.
The fix is obvious - make the last coordinate the fastest-growing one so that data is iterated over in the same order it is laid out in memory.
Result:
image=external/samples/Angular.png repeats=5 args={n=3 dstW=64 dstH=64}
        avg=2.6057 min=2.4360 max=2.8737
image=benchmark/test.txt repeats=5 args={n=5 dstW=120 dstH=120}
        avg=11.5774 min=11.3916 max=11.7893
That helped, but not as much as I expected it would. This leads me to suspect my code is bound on CPU and not memory lookups.
Let’s look at the new hottest instruction:
28.61 │ idiv %r15didiv is integer division and it’s not a terribly fast instruction. There are two ways I index into multi-dimensional arrays, one of them wraps around when an index is out of bounds. The function for wrapping indexing contains a modulo (%) operation, which is where this idiv is coming from. I refactored the code to not do wrapping indexing in the hottest path.
Result:
image=external/samples/Angular.png repeats=5 args={n=3 dstW=64 dstH=64}
        avg=1.3969 min=1.2609 max=1.4976
image=benchmark/test.txt repeats=5 args={n=5 dstW=120 dstH=120}
        avg=2.5965 min=2.5733 max=2.6412
Much better!
This is the hottest part of the propagation step, written in C-like pseudocode:
for (int pB = 0; pB < pattCnt; ++pB) {
    if (!wave[c0B, c1B, pB]) continue;

    int mayKeep = 0;
    for (int pA = 0; pA < pattCnt; ++pA) {
        if (wave[c0A, c1A, pA] && overlaps[offsetC0, offsetC1, pB, pA]) {
            mayKeep = 1;
            break;
        }
    }

    wave[c0B, c1B, pB] = mayKeep;
}
where:
pattCntis the number of different patterns;c0Aandc1Aare the coordinates of recently constrained wave point A;c0Bandc1Bare the coordinates of point B we’re now constraining based on patterns at point A;waveis the WFC wave (described previously);overlapsis the precalculated info on when two patterns are allowed to overlap;offsetC0andoffsetC1are the offsets between points A and B.
wave and overlaps are three-dimensional matrices of uint8_t (bools).
This piece of code can be described mathematically:
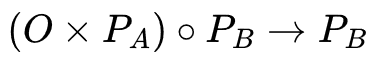
where:
Oisoverlaps[offsetC0, offsetC1, .., ..]- apattCnt * pattCntmatrix;Paiswave[c0A, c1A, ..]- an array denoting which patterns are allowed at point A;Pbis the same, but for point B;- cross is matrix-vector multiplication, the result is a vector with
pattCntelements; - circle is element-wise vector multiplication (aka. Hadamard product);
- arrow here means assignment, I assign back to the same array.
All elements are either 0 or 1. Scalar multiplication is actually logical AND, addition is logical OR.
I dealt with matrix multiplication code before, so this helps me reason about the performance of this snippet. With that in mind, I replaced logical AND (&&) with bitwise AND (&). Since all bytes are either 0 or 1, this shouldn’t affect the final output.
Result:
image=external/samples/Angular.png repeats=5 args={n=3 dstW=64 dstH=64}
        avg=1.1469 min=1.0137 max=1.3398
image=benchmark/test.txt repeats=5 args={n=5 dstW=120 dstH=120}
        avg=2.4485 min=2.4388 max=2.4603
Then, I removed break;.
Result:
image=external/samples/Angular.png repeats=5 args={n=3 dstW=64 dstH=64}
        avg=0.9388 min=0.8866 max=1.0048
image=benchmark/test.txt repeats=5 args={n=5 dstW=120 dstH=120}
        avg=1.3508 min=1.3412 max=1.3637
It looks like break was a bigger detriment to performance than an optimization it was supposed to be. I’m actually not certain if branch mispredictions were making the code slower or if removing break caused the loop body to become more homogenous and therefore faster for CPU to execute.
Moving on, I used a single uint8_t value to accumulate the bitwise AND results.
Code:
for (int pB = 0; pB < pattCnt; ++pB) {
    if (!wave[c0B, c1B, pB]) continue;

    uint8_t total = 0;
    for (int pA = 0; pA < pattCnt; ++pA) {
        total |= wave[c0A, c1A, pA] & overlaps[offsetC0, offsetC1, pB, pA];
    }

    wave[c0B, c1B, pB] = total;
}
Result:
image=external/samples/Angular.png repeats=5 args={n=3 dstW=64 dstH=64}
        avg=0.9357 min=0.8689 max=0.9795
image=benchmark/test.txt repeats=5 args={n=5 dstW=120 dstH=120}
        avg=0.8798 min=0.8678 max=0.8903
Faster still! The first case is now 10 times faster than when I started, and the second 20 times. Oddly, the second (larger) test case has become faster than the smaller one. I’m not exactly sure why.
If, at this point, I replace & with *, the benchmark reports slightly worse results. I suspect this is because uint8_t gets cast to int first and then cast back (that’s how C works). If I replace & with &&, the benchmark reports much worse results. I guess logical AND on uint8_t cannot be replaced with integer arithmetic, resulting in more machine instructions.
And I know what you’re thinking now. You’ve probably been internally shouting it at me: instead of storing one bool per byte, I should pack them tightly, so that each bit is utilized. Well, I did that. As a result, propagation did get faster, but other parts got slower. And I realized I am at a point where propagation is not always the slowest part of my code.
I have more optimization ideas, but this post is already way too long, so more on that next time.
Closing thoughts
This was not the first time I profiled code, but it is the first time I did it in this amount. Profiling and optimizing require some discipline and scientific rigor. Several times I made the mistake of blindly pursuing an idea, only to realize it was a waste of time. Optimization is still an arcane art - you need to possess some domain knowledge to be successful. The tools can tell you which parts of your code are slow, but you need to know what to do about it. And it’s all too easy to go down a dead end and waste time. However, sometimes you need to run wild experiments to progress forward.
All in all, I had fun and am looking forward to optimizing my WFC implementation further.
Until next time, enjoy some creepy-looking kittens.

Link dump
https://github.com/mxgmn/WaveFunctionCollapse
https://github.com/google/sanitizers
https://gcc.gnu.org/onlinedocs/gcc/Warning-Options.html
http://blog.httrack.com/blog/2014/03/09/what-are-your-gcc-flags
https://clang.llvm.org/docs/ClangCommandLineReference.html
https://clang.llvm.org/docs/ClangCommandLineReference.html#x86
https://www.gnu.org/software/make/manual/make.html#Empty-Targets
https://www.brendangregg.com/perf.html