Devlog: Wave Function Collapse #4: Optimizations, Intel VTune, My Own log2f, Instruction Parallelism
2023-10-01
| Prev | GitHub |
Optimizations, optimizations, optimizations… One of the main reasons I took on this seemingly aimless project was to log some hours into profiling and optimizing code. And, oh boy, did I end up spending hours staring at flame graphs and other stats screens.
Since this was meant to be a learning experience (and because I temporarily switched to a different computer), I was developing on Windows. So the first question was which profiling tool to use. I found several but ended up going with Intel VTune. By the end of this post, I will have fallen in love with it!
I’m not the first coder to write their own WFC implementation (ahem), so I took one existing implementation in C and ran it on my machine to have a point of comparison for how well I was doing.
First, for results to have any meaning, my setup is:
- Clang 16 with MSVC linker
- Windows 10
- Intel Core i7-8750H
Implementations would take this tiny 8x8 image:

and generate a 128x128 PNG out of it using WFC, with 3x3 patterns and with wrap-around and with flips and rotations enabled. Here’s an example of what the output may look like:

That other implementation performed the task in a respectable 0:02.14. (That’s 0 minutes and 2.14 seconds.)
My implementation? It took this long:
2:04.12
Not good. Let’s see how low that number can go!
Optimizing entropy calculation
When profiling, it’s good to start with the flame graph. In VTune this means running the Hotspots analysis.
The flame graph revealed that over 70% of the time was spent calculating binary logarithms.
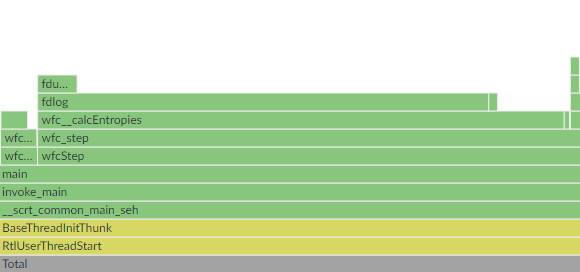
log2f can be slow because it is implemented to be very precise. Since high precision is not that important in this program and it wastes a lot of time, the solution was obvious - I would write my own log2f. I wrote about that in another post, so I won’t repeat the details here.
Something to notice here is that I was making a tradeoff. Often, optimizations are tradeoffs - usually you “optimize” programs by using more memory to perform a task quicker. In this case, I was giving up precision to gain speed and I have decided that this tradeoff was worth it.
Before I jumped into reimplementing log2f, something I’ve never done before, I first wanted to gauge the potential gain to decide whether that was even worth attempting. I replaced log2f with 1-1/x - a terrible approximation, but quick to implement. This revealed a huge potential performance improvement, so only then did I go off to research approximation methods for logarithms. Running times went down tremendously.
0:26.45
Shannon entropy calculations (part of code that calls log2f) were still taking up a lot of running time. Entropies are calculated for output pixels as their states get more and more determined. My implementation was recalculating entropies for each pixel on each iteration of the algorithm, even though most of their states were the same as in the previous iteration. I implemented a way to track which pixels’ states got modified during the latest iteration and only recalculated entropies for those.
0:12.09
Optimizing CLI and GUI
There was a new slowest part of the implementation.
A bit of context - I am writing WFC as a single-header standalone library. On the side, there are the CLI and GUI tools that call into that library. Those only use the public API.
I added a simple progress tracker that displays how many output pixels were solved out of the total number. To figure this out, CLI needed to go through each output pixel and then through its entire state, which was slow. I applied a similar solution as above - the CLI would keep a counter of how many pixels were solved and, between WFC iterations, only check whether modified pixels have just been solved in which case the counter gets increased. A pixel can’t ever get unsolved, so this works.
0:04.35
GUI had something of a similar problem. It animates how the algorithm is running, rendering each unsolved pixel as the average of values it could yet end up taking. The fix was also similar - only modified pixels would have their colors recalculated. This did help, but GUI was still very sluggish. Hmm, what was the issue?

Oh, right, of course. I capped FPS to 60 and only one WFC iteration happens per frame. I “optimized” the GUI by adding user controls for running multiple iterations per frame. This lets the user speed up execution however they prefer.
Optimizing propagation
Propagation was now the slowest part of the code.
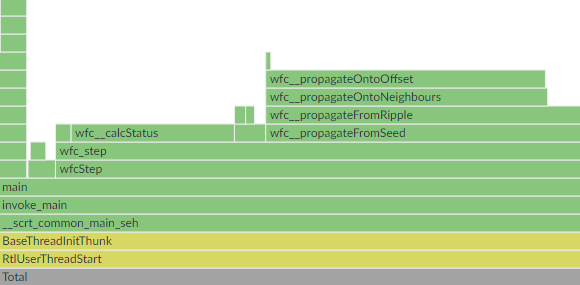
During each iteration, WFC picks one of the output pixels tied for the lowest entropy and sets its entire state to a single possible value. It then has to do constraint propagation to neighbouring pixels. If any of those get their state modified, they propagate constraints to their neighbours, and on and on until there are no more state updates.
The “neighbourhood” of a pixel is determined by the size of patterns. In the example I’ve shown above, patterns are 3x3 pixels, so the neighbours of a pixel are in a 5x5 window around it (wrapping around any image borders). If you center a 3x3 pattern on the pixel in question and one of its neighbours those patterns will intersect.
I already tried thinking of algorithmic ways to optimize this part but was stuck. So I looked through some other WFC implementations and found an interesting idea (link, link, link). Instead of propagating constraints to all neighbours in the 5x5 window (or however large), only propagate to the 4 cardinal neighbours. The reason this is faster is that usually only very few (if any) of the neighbours get updated, and propagation is an algorithmically complex process (in terms of big O) that happens very often.
The idea is that all constraints would eventually get fully propagated to all neighbours, the process would just be taking multiple steps on the way to get to more far away neighbours. It’s a clever idea that felt correct, but I wasn’t fully sure if eventually all constraints would really get propagated. What I did was I ran the new propagation code and then followed it up with the old one, running that on several different inputs and re-running WFC many times (it’s a non-deterministic algorithm). Never once did the old code make any additional updates, so I figured the new code was indeed correct.
0:02.88
I then made the same old recalculate-only-for-modified-pixels optimization to a different part of the codebase (that wfc__calcStatus function in the picture above) - nothing too interesting.
0:01.69
My implementation was now faster than the one I was comparing it with. I felt nice about that, but why stop here?
We should take a step back first and acknowledge that at this point shaving off a few hundred ms from a program that will rarely run is kind of pointless. Optimizations are tradeoffs and one part of that tradeoff is that code usually gets more complex and interlaced with added internal assumptions. But another thing is also important to note - this project is my playground and I get to do what I want with it!
Also, it turns out that for 256x256 outputs running times were much larger clocking in at around 0:18.80. Profiling those makes more sense, so profiler results in the remainder of this post will be from running the program with that output size.
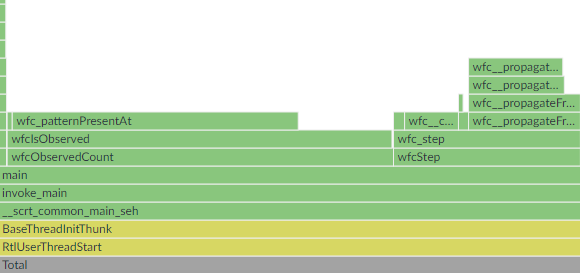
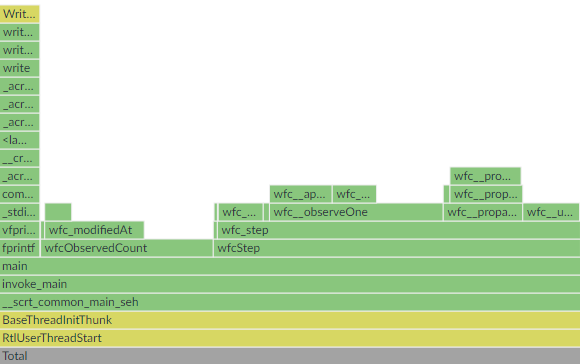
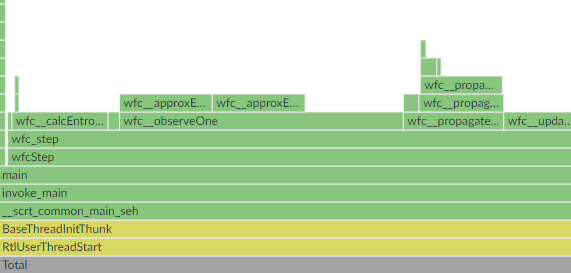
This is the point where VTune starts to shine. First, let’s look at the flame graph again.
wfc__propagateFromRipple had a large self-time. VTune reported that this line in the function was the biggest hotspot:
if (!WFC__A2D_GET(ripple, nC0, nC1)) continue;This line checks whether an element in a matrix of bools is set to true. This being an if-statement made me think this could be an issue with branch mispredicts. Let’s run VTune’s Performance Snapshot analysis.

Now let’s see what Microarchitecture Exploration has to say about this function*.
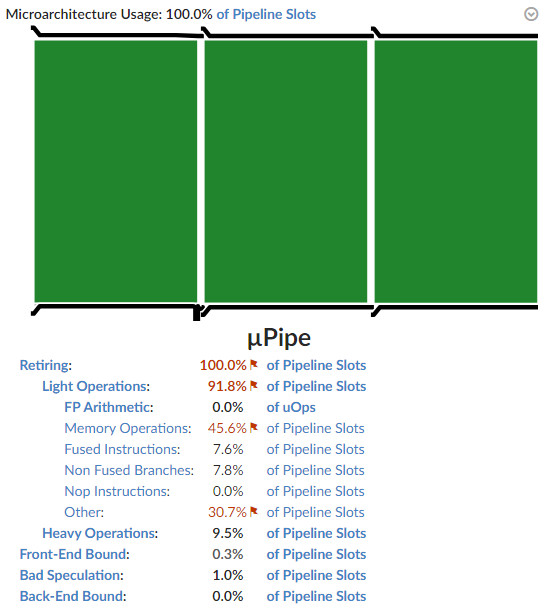
So it’s not about bad speculation (aka. high branch mispredict rate). The program is also not memory-bound.
What the profiler is saying is that, whatever this function is doing, it is doing it very efficiently. Unfortunately, most of what it’s doing is rubbish that consists of a lot of memory loads, when I’d prefer it to consist of mostly useful calculations instead.
My propagation code is split into multiple parts. wfc__propagateFromRipple was maintaining a matrix of bools indicating which pixels’ states were recently modified. It iterated through the entire matrix, propagating constraints only from pixels marked as recently modified and resetting their bools back to false. All neighbours whose state would get further constrained got their bool set to true. This entire process would repeat until there was one iteration through the entire matrix that resulted in no new updates, which is when we know there are no more constraints left to propagate.
The optimization I wanted to make was to, instead of iterating through the entire matrix, only jump between elements I knew had been recently modified. In C++, this could be implemented by keeping a std::queue of coordinates to visit and a std::unordered_set to make sure that the queue contains unique coordinates. And that would all work (there are libraries for data structures in C) and it would probably make the code faster.
But, C had set its fangs deep in me and I got squeamish about gratuitous memory (de)allocations. So I came up with a creative alternative way of implementing this idea.
I already had a 2D matrix. Instead of storing bools, I’d use it to store a linked list of pixels whose states were recently modified. Except, instead of pointers, each element would store the 1D index of the next pixel in the list. (It is trivial to convert between 1D index and 2D coordinates.) There would also be head and tail variables with indexes of starting and ending elements. Elements outside of the list, as well as the tail element, would keep an invalid index instead of an index to the next element - this is how I’d know which elements are not in the list.
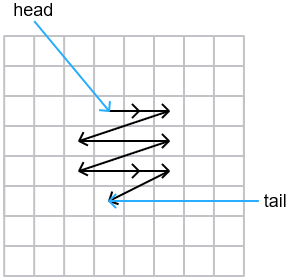
Newly modified neighbours would get added to the end of the list, provided that they weren’t in the list already. The function would look at the element indicated by the head variable, propagate constraints from that pixel to its four cardinal neighbours, remove it from the list, and then keep going as long as the list is non-empty.
0:01.29
(*) When running VTune, I sometimes get: Error 0x40000024 (No data). What I found helps is: closing ALL other programs, running VTune as administrator, and rerunning the analysis a couple of times.
Optimizing CLI again
At this point, all parts of the program were fast and I was scraping last bits of performance I could find. I focused on the CLI’s progress tracker.
Progress display was getting updated after each iteration of the algorithm, which gave the user the latest status update. But did it really need to update that often? There are hundreds of iterations every second - that’s more updates than the human eye can even see. Hell, it’s more refreshes that the monitor can display. I decided to limit CLI to only one fprintf call every 100 iterations.
0:01.00
I also removed the part where CLI walks through pixels’ states to figure out how many are solved and incorporated that as a counter straight into the library. The library can increment the counter faster since it readily knows when a pixel gets fully solved.
0:00.90
Optimizing propagation again
There were two classes of “large” cases that made the program slow in different ways. One we’ve seen is when the output dimensions are large. The other is when an input image contains a lot of patterns, in which case propagation becomes the biggest hotspot. This can happen when the input image is large or just complex, or when the pattern size is large.
Deep in the propagation code was a set of bitwise matrix operations which VTune marked as taking up almost all of the running time:
    uint8_t total = 0;
    for (int pN = 0; pN < pattCnt; ++pN) {
        total |= WFC__A3D_GET(wave, c0, c1, pN) &
            WFC__A3D_GET(overlaps, dirOpposite, p, pN);
    }
According to Microarchitecture Exploration, the program was both memory-bound and core-bound.
The wave matrix holds states for all pixels and it can get too large to fit in CPU caches. It contained one bool of information per byte. What I did here is that I compressed wave and overlaps matrices so they would store one bool per bit. This not only reduced their sizes making for fewer memory fetches, but also made each bitwise operation do more useful work. I like this optimization because it both made the program faster and reduced its RAM consumption.
0:00.80
I tried making propagation even faster by using SIMD instructions, but it barely made any difference, so I gave up on that. It turned out that Clang was already vectorizing the loop and my attempts at SIMD were a minor benefit, if any.
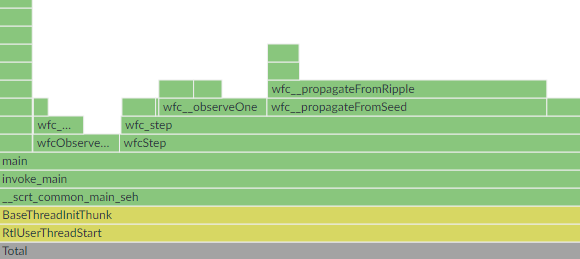
Optimizing observation
New flame graph:
Observation happens near the start of each WFC iteration, after calculating new entropy values. It refers to the process of randomly picking one of the pixels tied for the lowest entropy, then randomly picking one of the remaining values from its state and assigning it that value. (The reason for calling this observation are parallels to quantum mechanics in the original algorithm proposal.)
Since floats should not be compared for equality directly, I had a a function for approximate comparison - you can see that function now appears on the flame graph. I rewrote this function to compare bit representations of floats instead, which is faster and more accurate at the cost of assuming IEEE 754 representation of floats, which was already assumed by my log2f implementation and is fairly ubiquitous anyway.
0:00.75
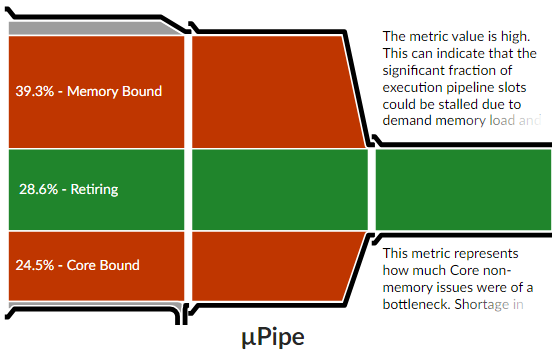
This is what Microarchitecture Exploration has to say about the function at this point:
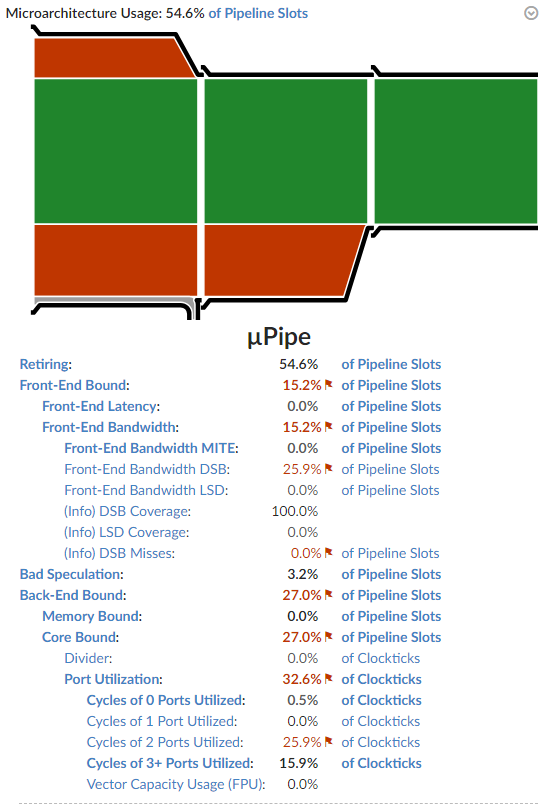
VTune’s tooltip for Core Bound issues states that they may come from dependencies in the program’s instructions. You can see that port utilization for 2 and 3+ was much higher than for 0 and 1.
This is the code VTune considers the hottest:
    float smallest = 0;
    // The number of different wave points tied for the smallest entropy.
    int smallestCnt = 0;
    for (int i = 0; i < WFC__A2D_LEN(entropies); ++i) {
        // Skip collapsed points.
        if (entropies.a[i] == 0.0f) continue;

        if (smallestCnt > 0 &&
            wfc__approxEqNonNeg_f(entropies.a[i], smallest)) {
            ++smallestCnt;
        } else if (smallestCnt == 0 || entropies.a[i] < smallest) {
            smallest = entropies.a[i];
            smallestCnt = 1;
        }
    }
Question: can you find a way to optimize it?
First, I changed another piece of code to set the entropy of fully solved pixels to FLT_MAX (the largest float). This is mathematically incorrect as their entropy should be 0, but it got me rid of that pesky if-statement. Then, I split the code into two parts - one would find the smallest entropy, the other would calculate how many times that (approximate) entropy appears.
    float smallest = entropies.a[0];
    for (int i = 1; i < WFC__A2D_LEN(entropies); ++i) {
        smallest = wfc__min_f(smallest, entropies.a[i]);
    }

    int smallestCnt = 0;
    for (int i = 0; i < WFC__A2D_LEN(entropies); ++i) {
        if (wfc__approxEqNonNeg_f(entropies.a[i], smallest)) ++smallestCnt;
    }
Can you see it now?
This assembly is from within the first loop:
vminss xmm0, xmm6, dword ptr [rax+r10*4+0x4]
vminss xmm0, xmm0, dword ptr [rax+r10*4+0x8]
vminss xmm0, xmm0, dword ptr [rax+r10*4+0xc]
vminss xmm0, xmm0, dword ptr [rax+r10*4+0x10]
vminss xmm0, xmm0, dword ptr [rax+r10*4+0x14]
vminss xmm0, xmm0, dword ptr [rax+r10*4+0x18]
vminss xmm0, xmm0, dword ptr [rax+r10*4+0x1c]
vminss xmm6, xmm0, dword ptr [rax+r10*4+0x20]
Clang unrolled the loop to make for fewer condition and increment operations as a speedup, but almost each vminss instruction (basically float comparison) reused register xmm0 as both source and destination, making each instruction dependent on the result of the previous one. Because of this, the CPU must execute these instructions one at a time.
My solution was to split the calculation into multiple channels which could be run in parallel, then aggregate them into the final result after the loop.
    // enum { wfc__loopChannels = 4 };

    float smallest;
    {
        float smallestA[wfc__loopChannels];
        for (int c = 0; c < wfc__loopChannels; ++c) smallestA[c] = FLT_MAX;

        for (int i = 0; i < WFC__A2D_LEN(entropies); i += wfc__loopChannels) {
            for (int c = 0; c < wfc__loopChannels; ++c) {
                smallestA[c] = wfc__min_f(smallestA[c], entropies.a[i + c]);
            }
        }

        smallest = FLT_MAX;
        for (int c = 0; c < wfc__loopChannels; ++c) {
            smallest = wfc__min_f(smallest, smallestA[c]);
        }
    }

    int smallestCnt = 0;
    for (int i = 0; i < WFC__A2D_LEN(entropies); ++i) {
        if (wfc__approxEqNonNeg_f(entropies.a[i], smallest)) ++smallestCnt;
    }
Rewriting the first loop in this way enables the CPU to use multiple ports to execute float comparison operations, thus increasing instruction throughput which makes the code execute faster.
I tried doing the same for the second part, but it had no measurable effect on performance.
Astute readers may notice that this solution appears to read elements past the end of the entropies array when its length is not divisible by 4. This is why I changed the allocation of this array to reserve extra memory to fit enough elements up to the next multiple of 4. I filled this memory with FLT_MAX as this value is a no-op for these calculations. The length of the array itself remained the same, it’s just that it became safe to read past its end.
This did seem a bit hacky, which is why I added comments to the code explaining what was happening and why.
0:00.68
The running time for the case when outputs were 256x256 pixels (all else was the same) went down to around 0:04.93.
Closing thoughts
One could probably keep digging and squeeze out more performance, but I think I’ve gone a bit too far as-is.
Optimizing a codebase I know each detail of was very fun. Most of the time I had several ideas in mind of what I could try next but, as I already said, optimizations tend to be tradeoffs. Plus, they can take time and effort to implement. This is why I always looked at profiler results first to inform me on what is worth attempting and which ideas I shouldn’t bother with.
Intel VTune was amazing in this regard! You run Performance Snapshot first, then follow up with Hotspots to see the flame graph and which lines of code are the biggest hotspots, then you run Microarchitecture Exploration (or one of the other analysis types) to see in what ways the hotspots are being slow. Is the code making bad use of CPU caches, are there lots of branch mispredicts, should workload be better parallelized, should you write SIMD code? Optimize accordingly, benchmark to confirm the improvement, then rinse and repeat.
Virtually every stat in VTune has a helpful tooltip to tell you what it means and advise you on what you should do about it. Its GUI lets you manage projects and look at your previous results. All in all, it’s a great tool!
As for my plans for this project, I wanted to implement more features (eg. ability to generate 3D outputs), but I think I’ll take a break from it for a while to focus on other things.
Until next time, here’s GUI generating a 256x256 image (roguelike dungeon layout?) at full speed:

Link dump
https://github.com/vplesko/libwfc
https://github.com/mxgmn/WaveFunctionCollapse
https://github.com/math-fehr/fast-wfc
https://www.intel.com/content/www/us/en/developer/tools/oneapi/vtune-profiler.html
https://en.wikipedia.org/wiki/Entropy_(information_theory)
https://en.wikipedia.org/wiki/Constraint_satisfaction_problem
https://www.dataorienteddesign.com/dodbook
https://embeddedartistry.com/blog/2017/02/22/generating-aligned-memory
https://www.intel.com/content/www/us/en/docs/intrinsics-guide/index.html